Bias Metrics
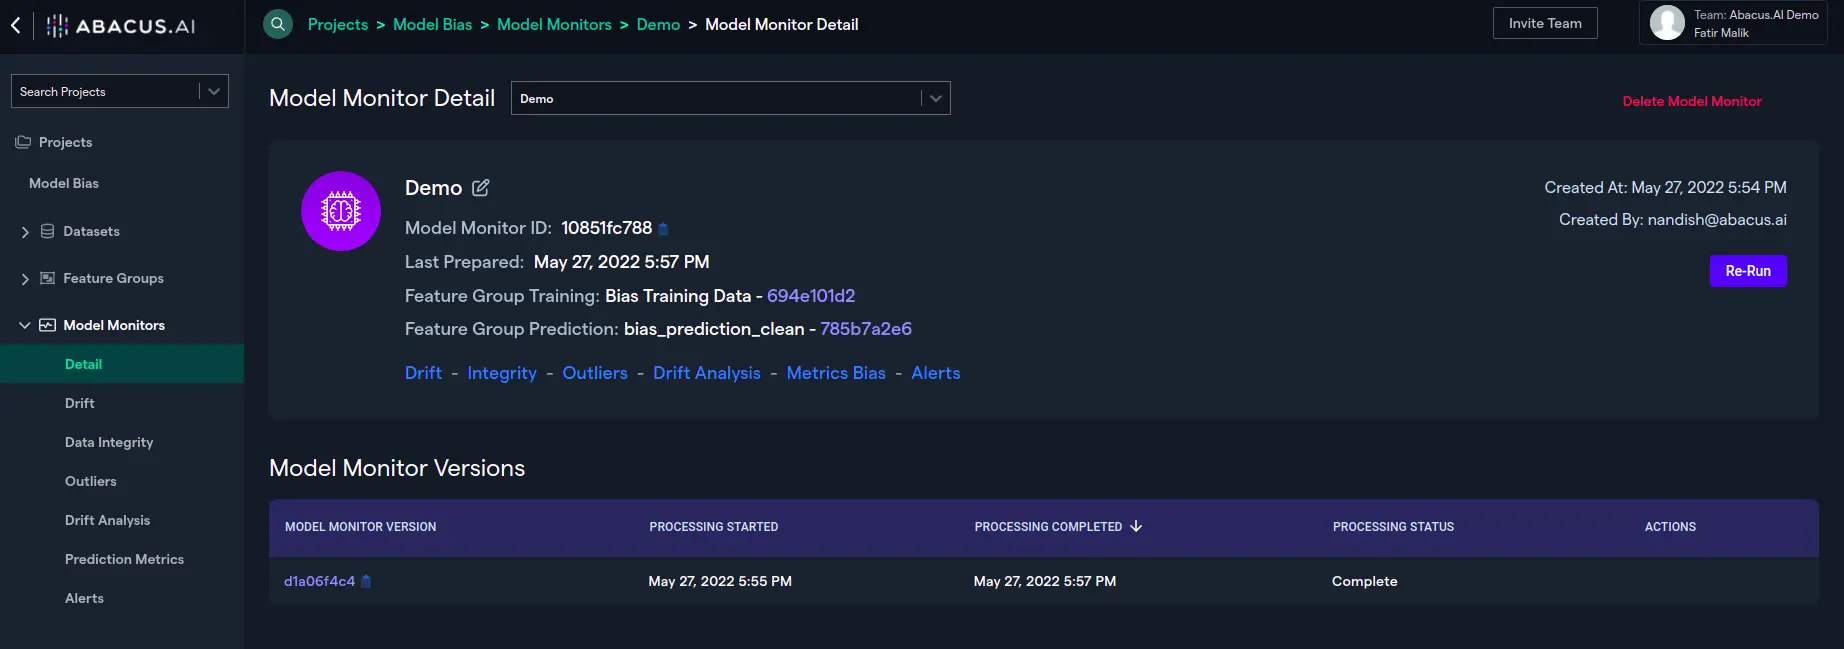
The bias metrics for a model monitor can be explored by selecting the model monitor's "Detail" in the left navigation bar and then clicking on "Metrics Bias".
On the bias metrics screen, select the protected class in order to explore the Demographic Parity, Equal Opportunity, Group Benefit Equality, and Confusion Matrix for the class selected. From the dropdown menu, we have chosen "Gender" to inspect the AI model's biasness on segments of the protected class. Gender has two segments: Male and Female.
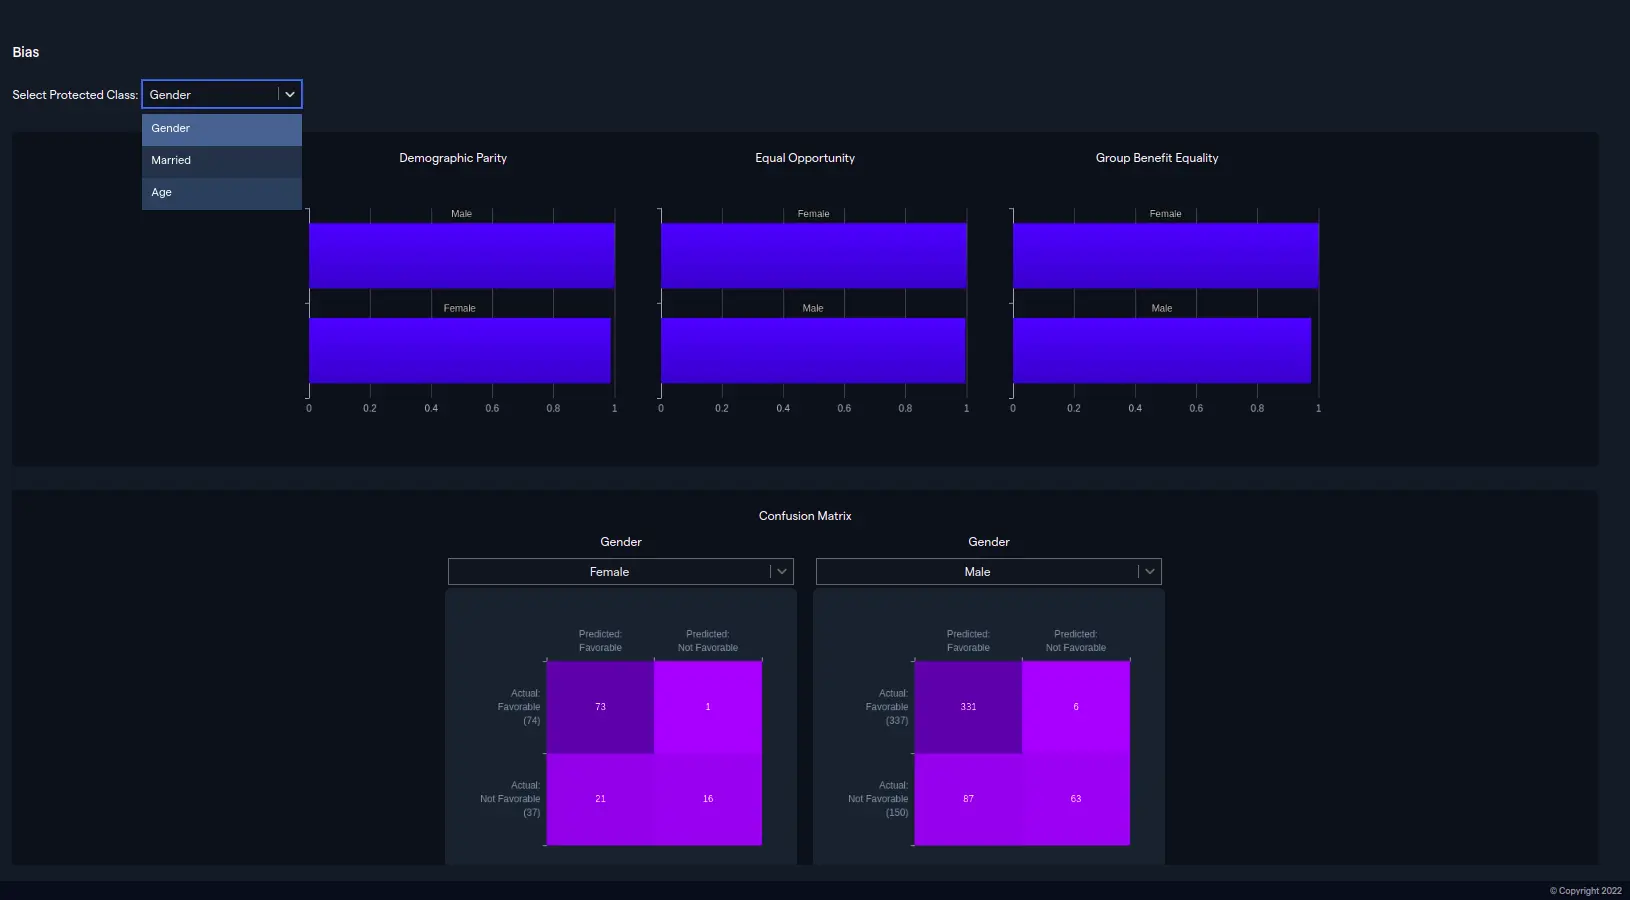
The "Demographic Parity" plot is divided into segments of the protected class. The plot uses the Positive Rate (people granted loans successfully) for each segment i.e. Male and Female visible in the confusion matrix below. In our case, we can see that the probabilities of "Male" and "Female" getting the loan successfully are almost equal i.e. the difference between Positive Rates across all segments is almost negligible. This depicts the overall fairness of the model and concludes that the gender of a person doesn't primarily decide the decision of granting or not granting the loan.

Similar to the "Demographic Parity", "Equal Opportunity" gives an idea about the fairness of the AI model by displaying the percentages of people who have rightfully benefitted from the model. In our case, this means that "male" and "female" pupils who were granted loans truly qualified for it and deserved it. To evaluate the fairness of the model, "equal opportunity" plot shows the True Positive Rate (TPR) for both class segments. Like the "demographic parity" metric, the lesser the gap is between both class segments' TPR as shown in the Equal Opportunity plot, the more fair the model is.

"Group Benefit Equality" is another metric to understand the bias of an AI model. It's calculated by dividing the sum of True and False Positives by the sum of True Positives and False Negatives. This metric calculates the positive predictions for all small subgroups in every segment of the protected class. If the positive predictions for all segments are equal or extremely close to each other across the segments like in our case, the model isn't biased or unfair towards any segment.
