Adding Model Monitoring To Existing Workflows
Once you have your model deployed, you are ready to get your predictions. You can either create a batch prediction or use the prediction dashboard to make real-time predictions on the test data. Additionally, you could also use the prediction API to generate predictions. Based on the nature of the predictions generated, the Monitoring section will have batch and/or real-time monitoring.
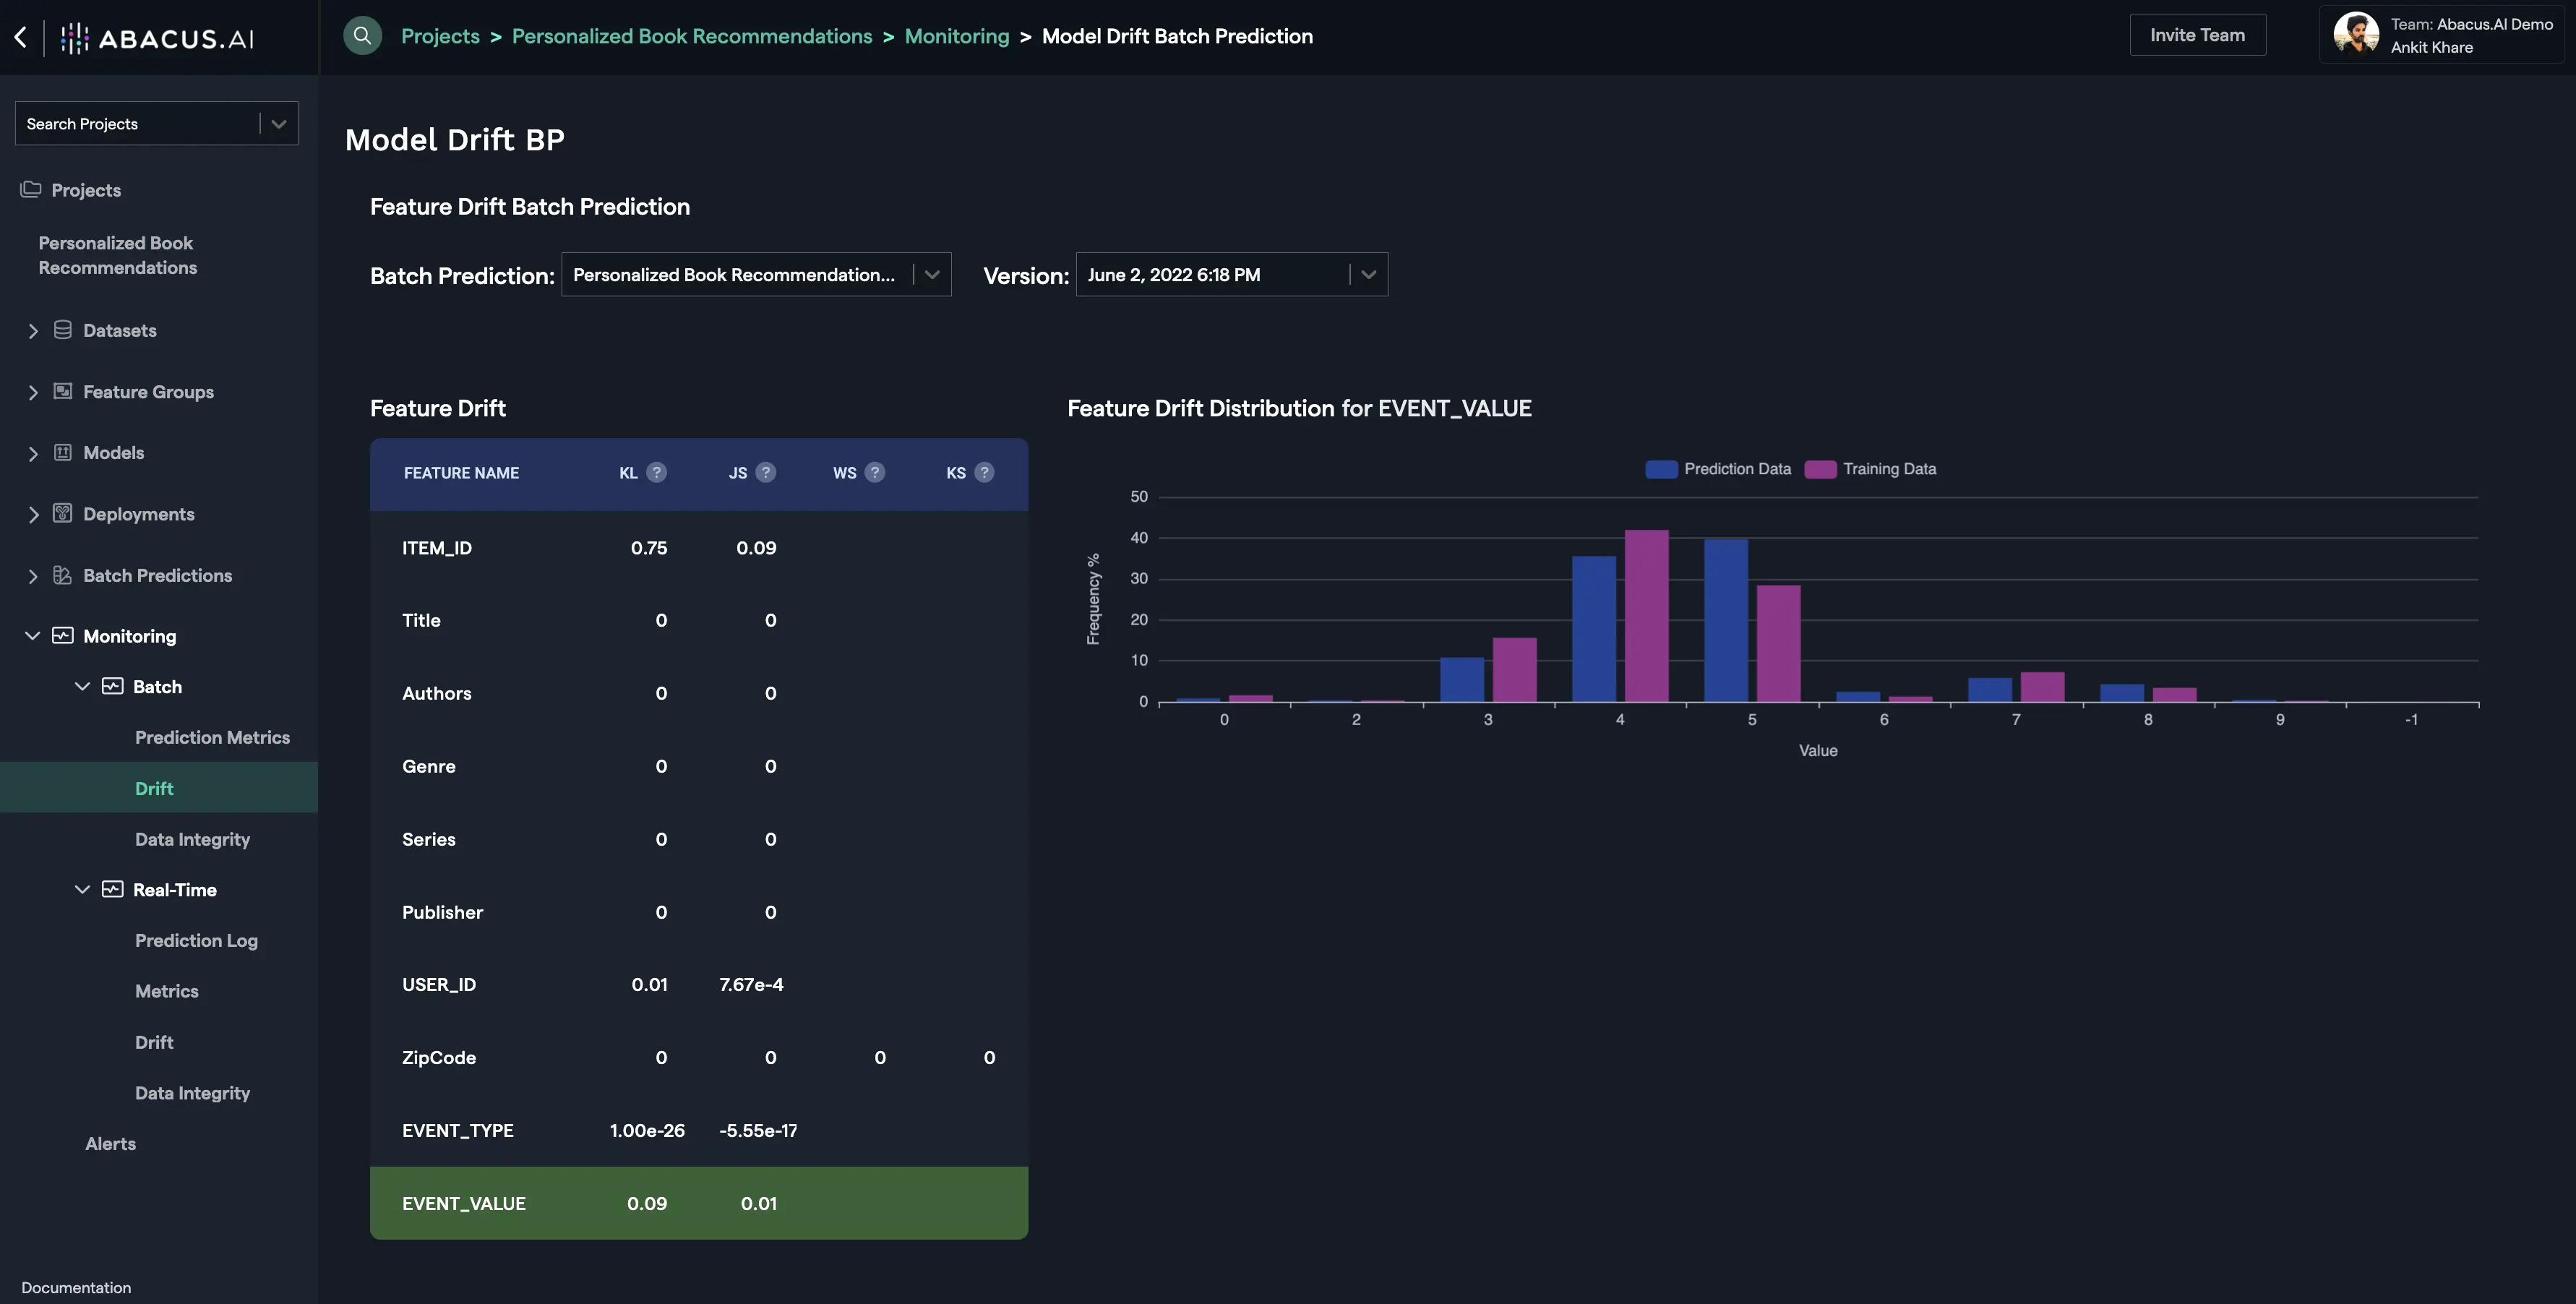
Batch Monitoring
Batch Drift is tied to the Batch Prediction versions. For each batch prediction version, feature drift is calculated for each feature. Depending upon the problem type and the availability of actual values for the prediction data, prediction drift is calculated.
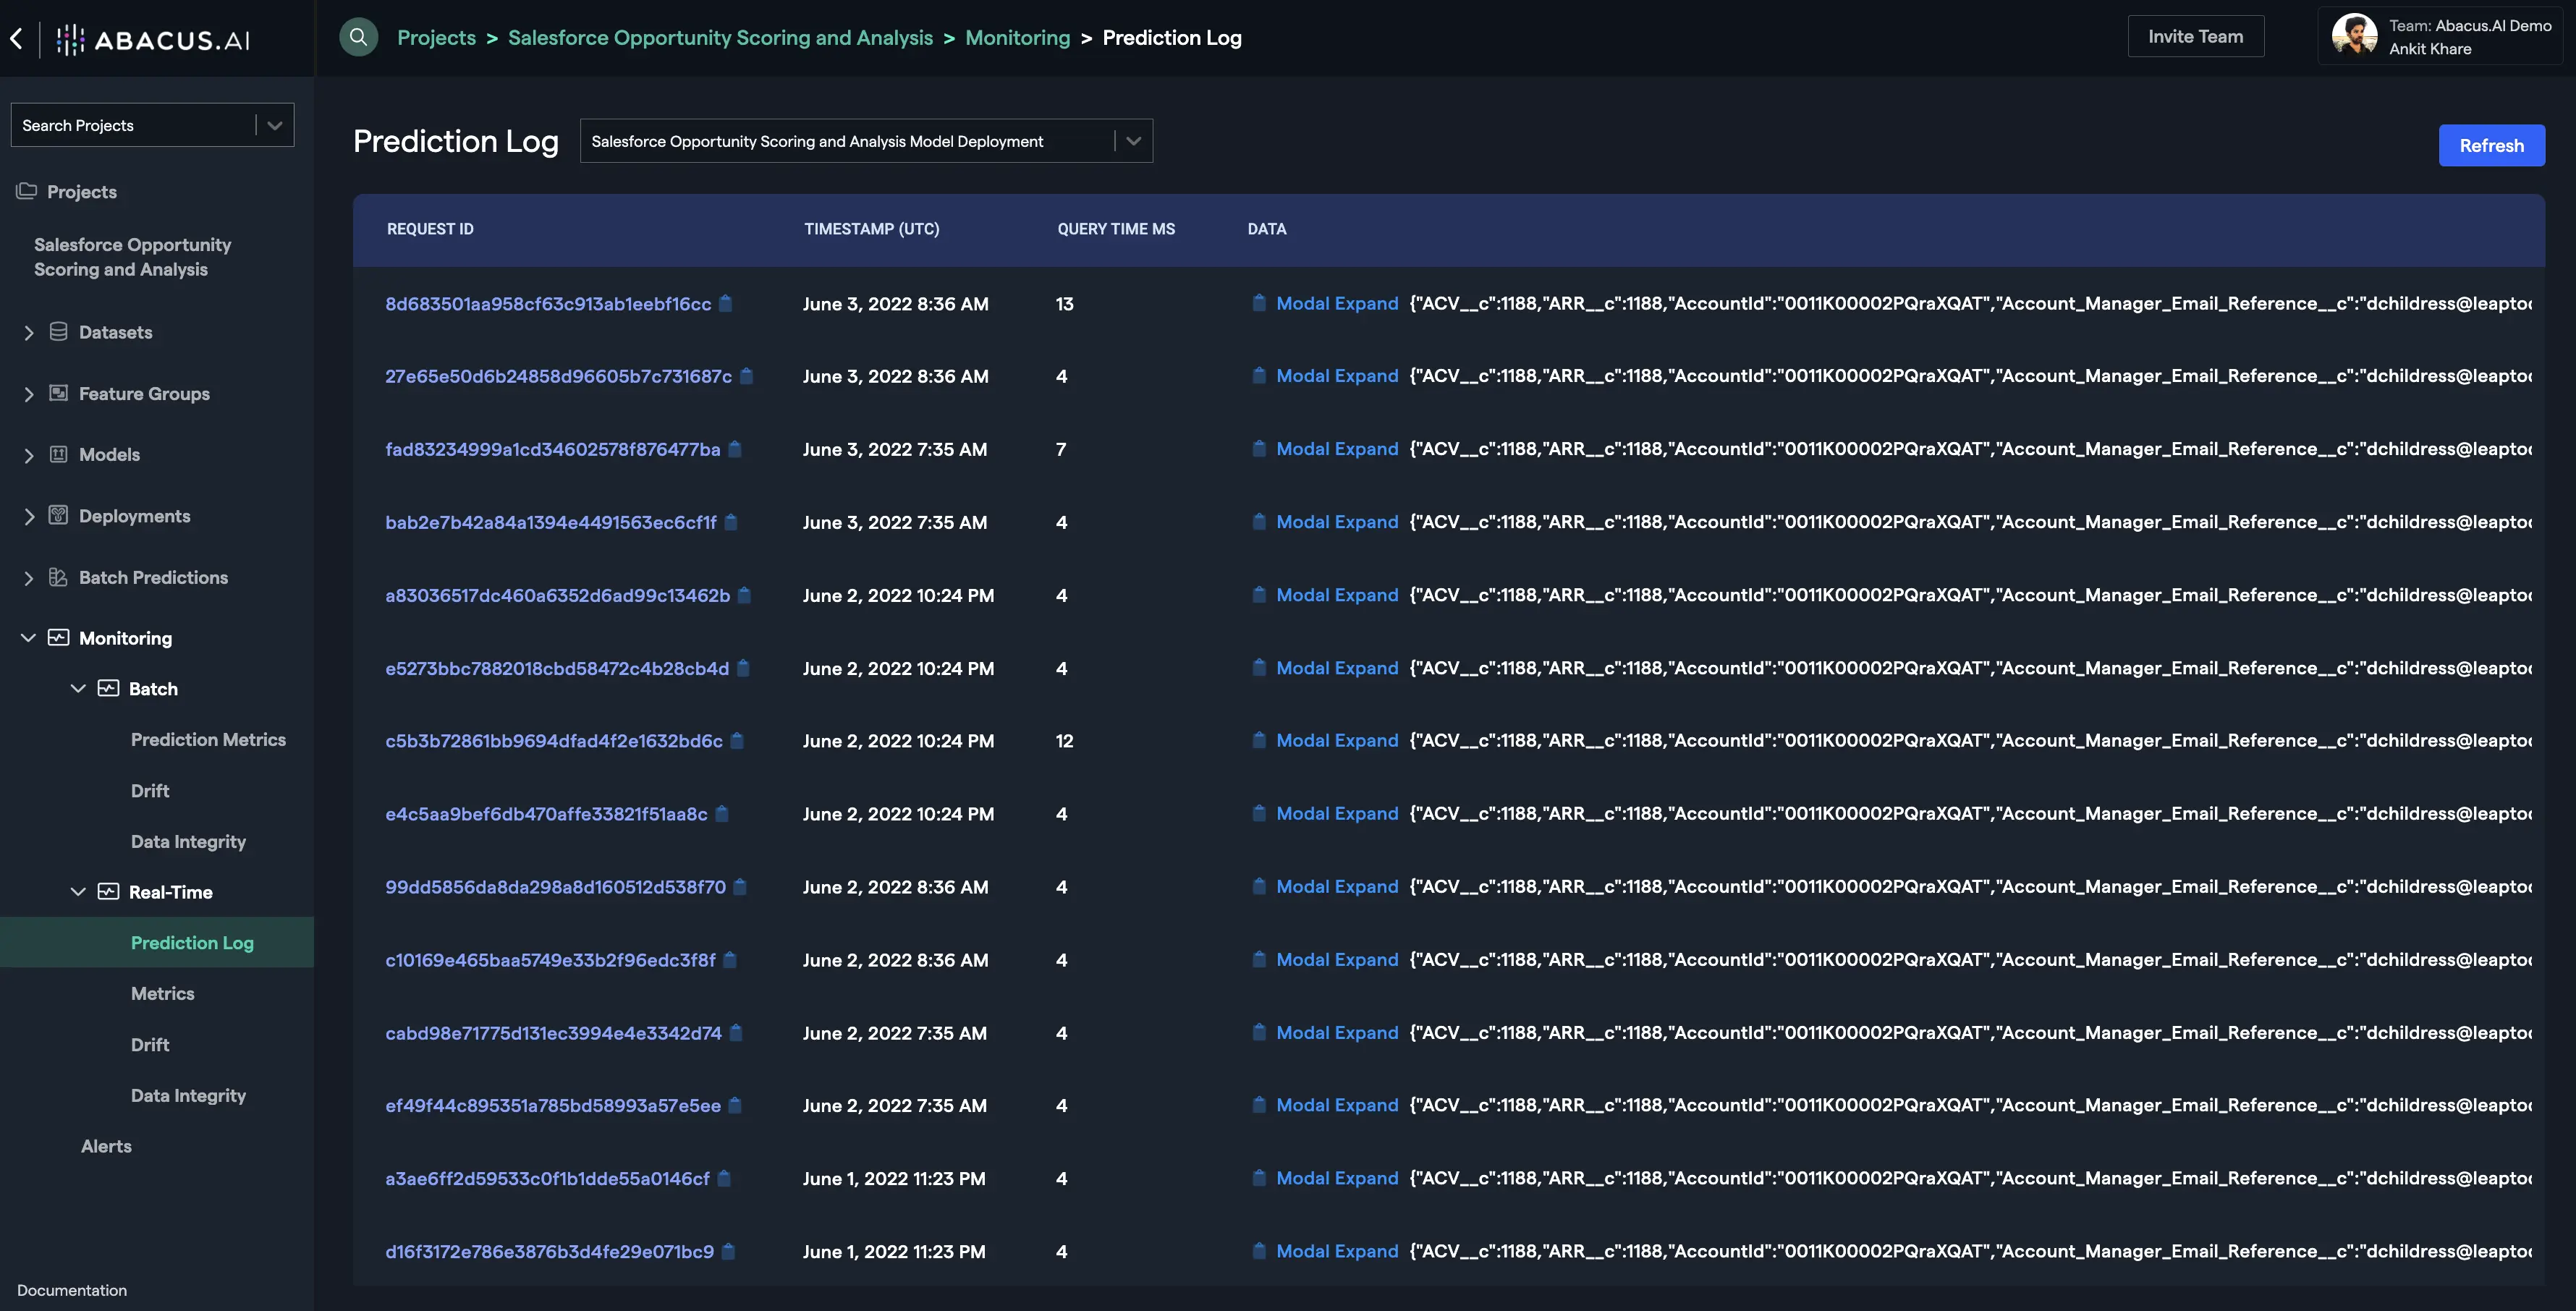
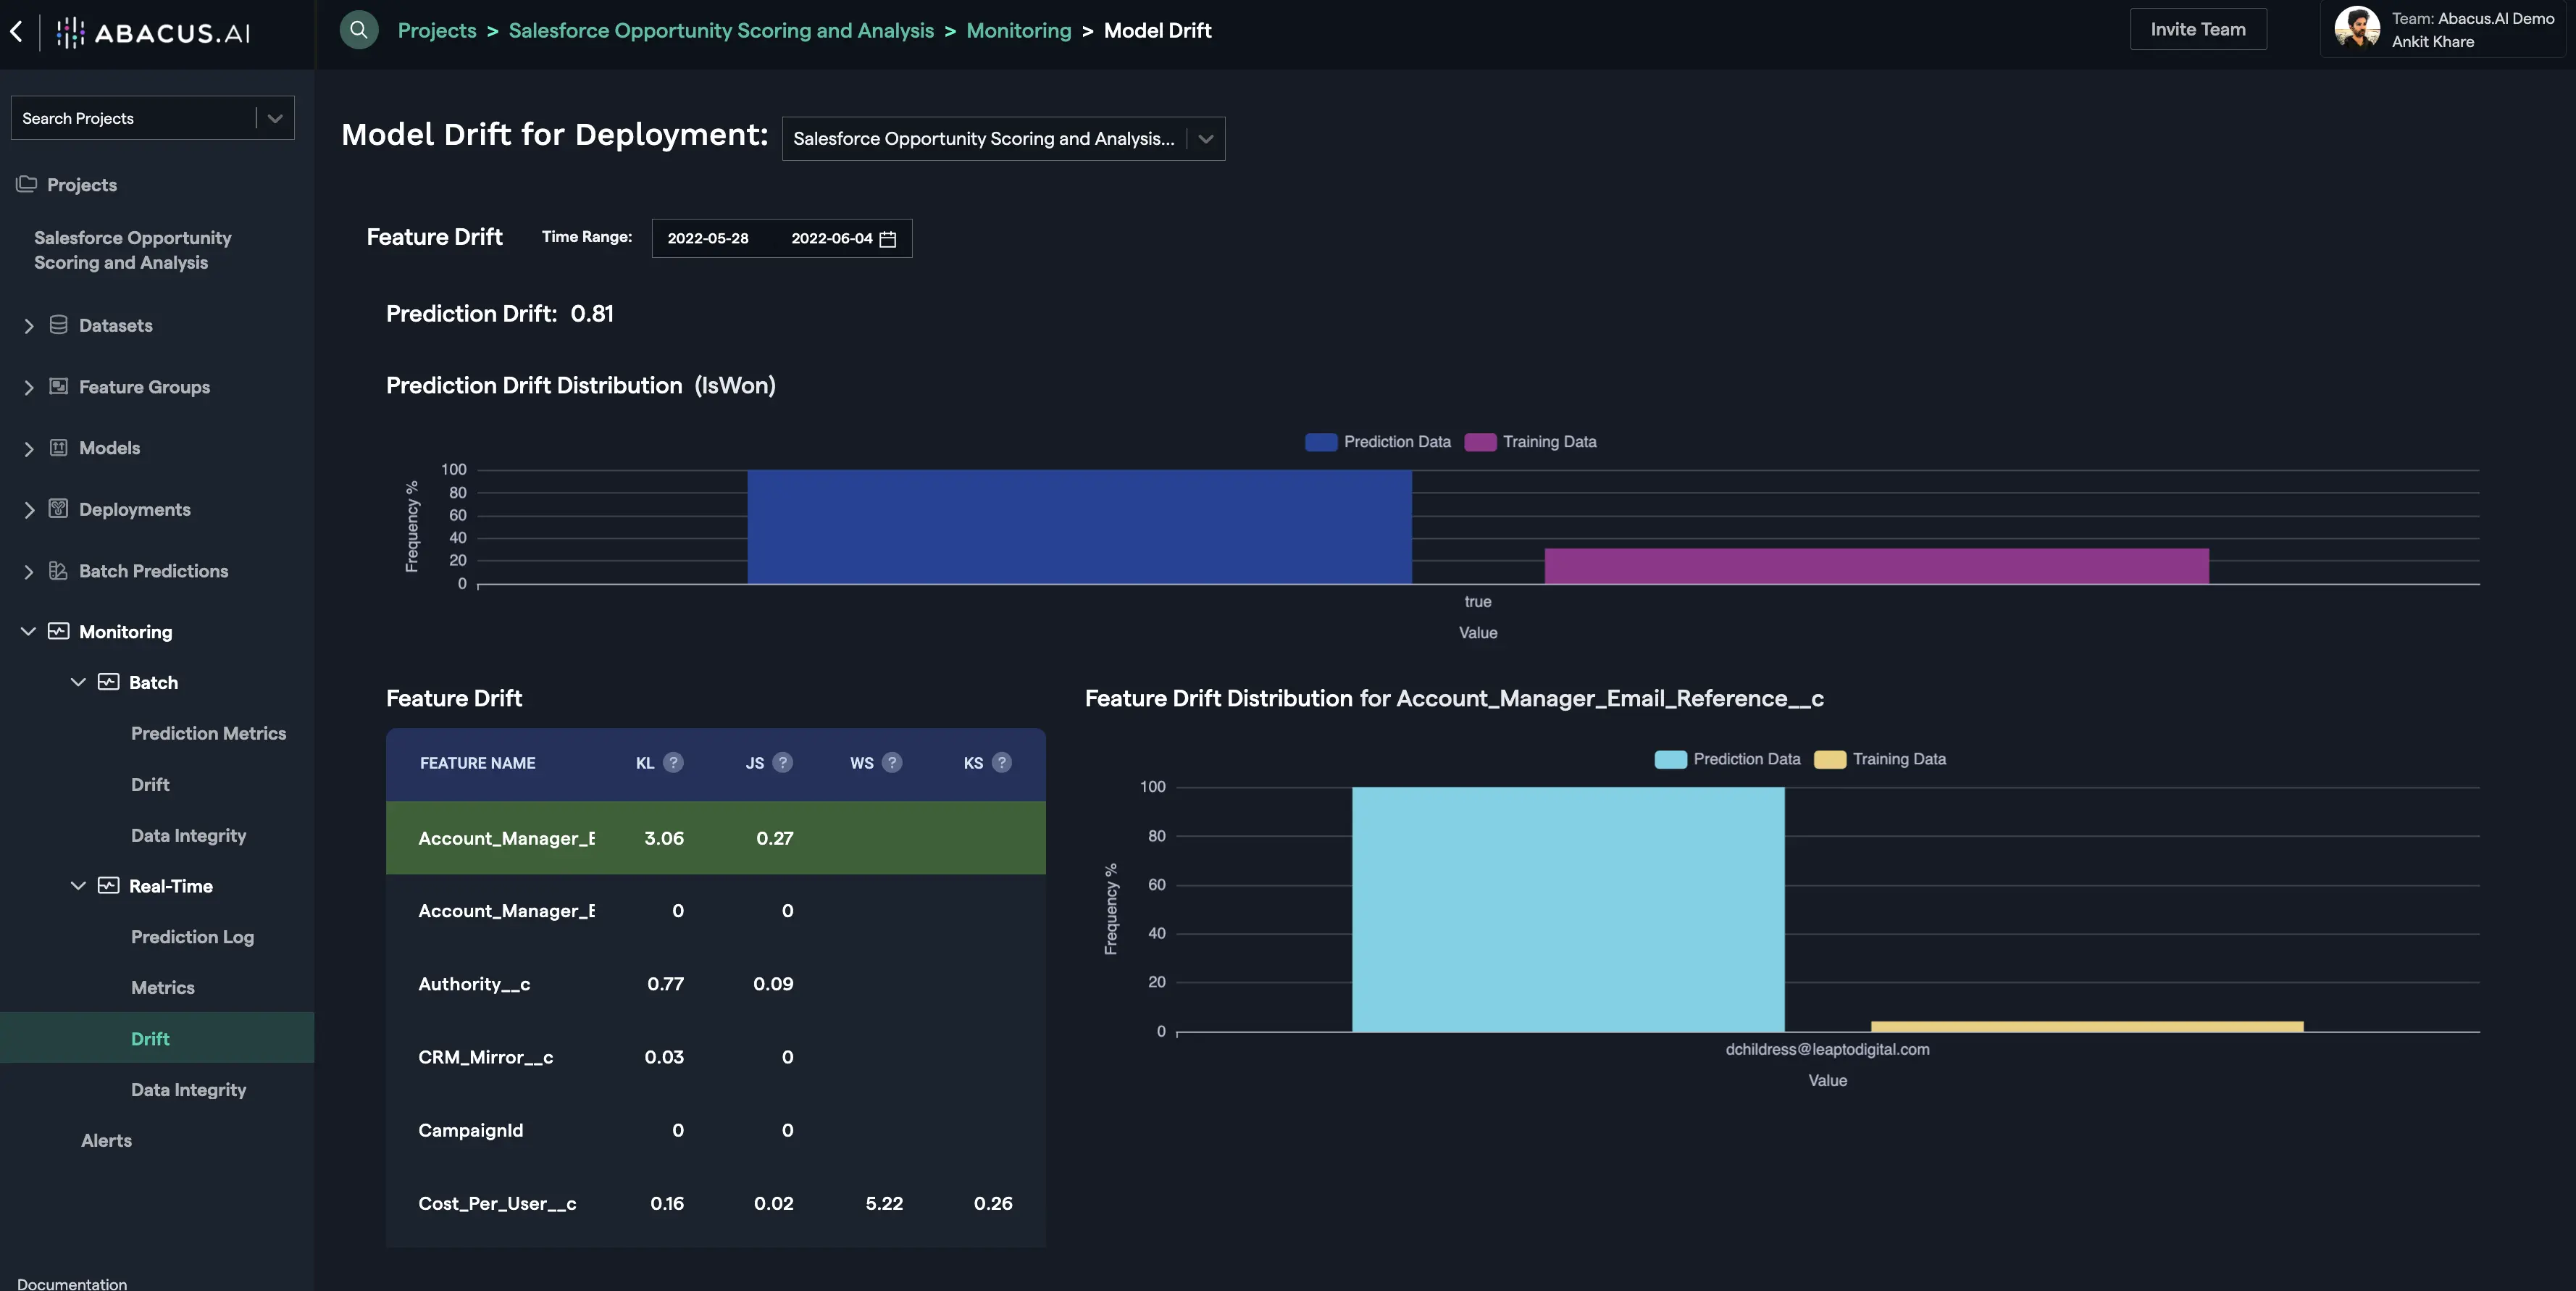
Real-Time Monitoring
Real-time drift comes from the prediction logs generated when the Prediction API and/or the Prediction Dashboard are used to make predictions. You can go to the prediction logs interface to get the details of the generated predictions. Click on any of the logs to see the details associated with the prediction (actual value, predicted value, probability, corresponding data record for the prediction, etc.).
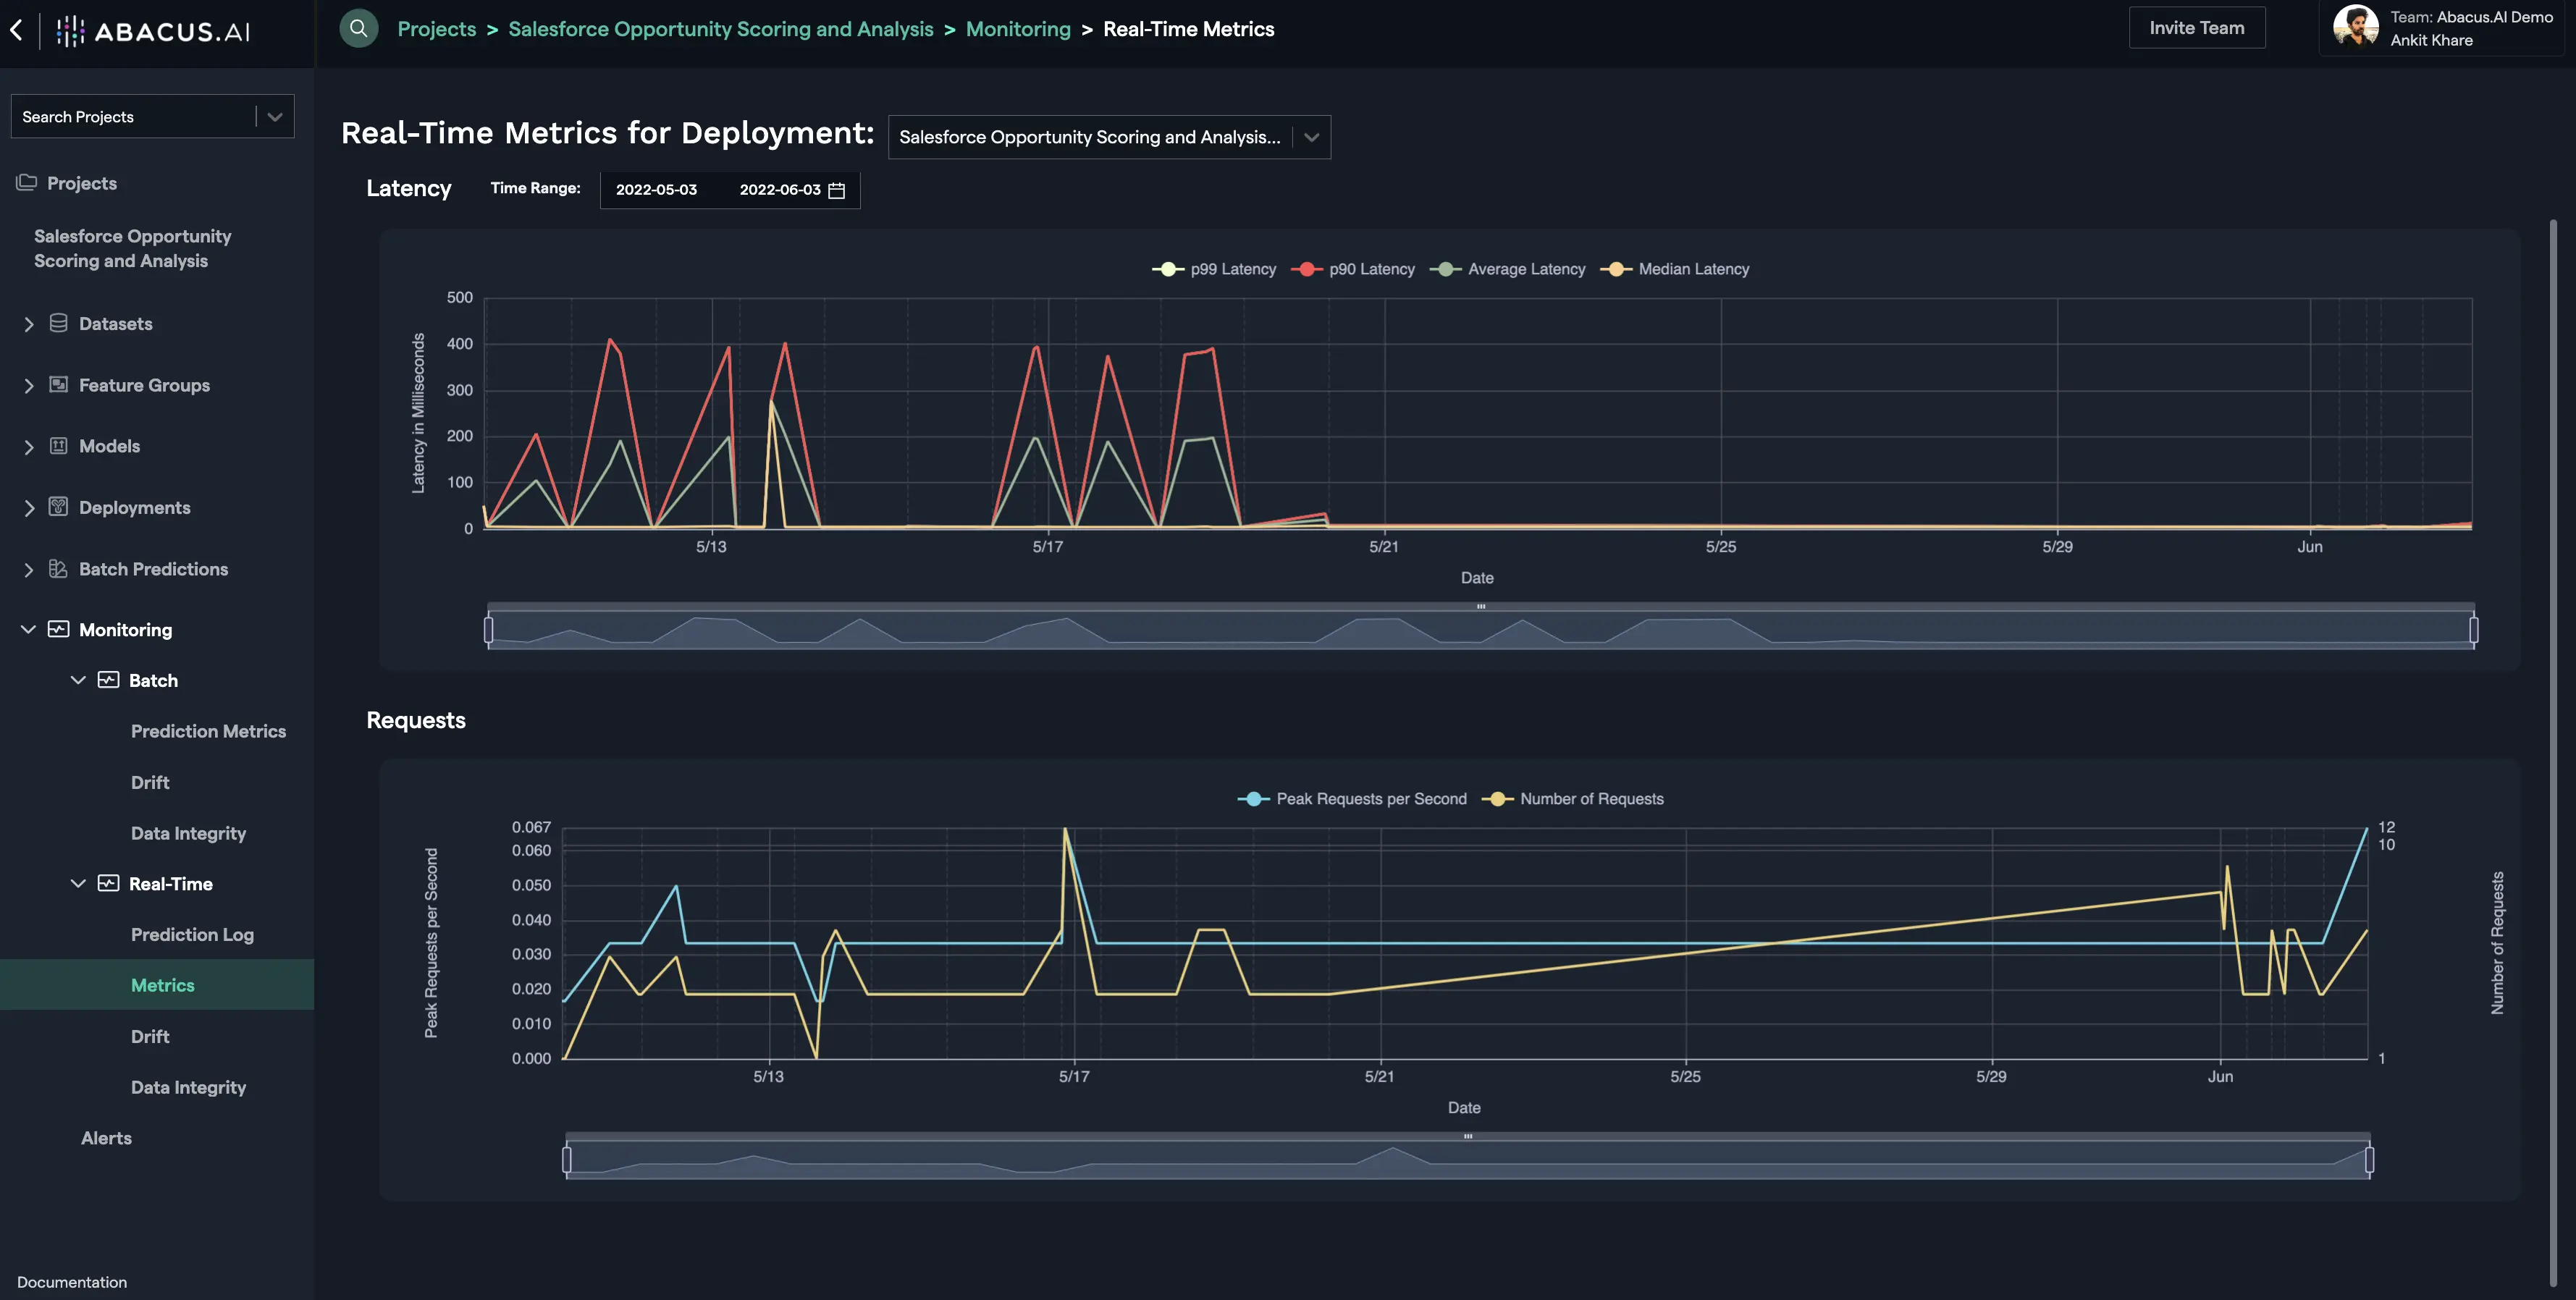
Real-Time Metrics for Deployment
All the models hosted on the Abacus.AI platform are monitored at Real-Time. Once the model is deployment and the deployment is active, you can go to the Real-Time Metrics interface to visualize: (i) the history of the requests (peak requests per second and Number of Requests) that were made to the deployed model; and (ii) the latency in servicing those requests. The latency is a long-tail distribution, so probabilistic statistics - P90, P99, P50 (aka average), and median are reported.