Creating a Monitor for a custom Chatbot
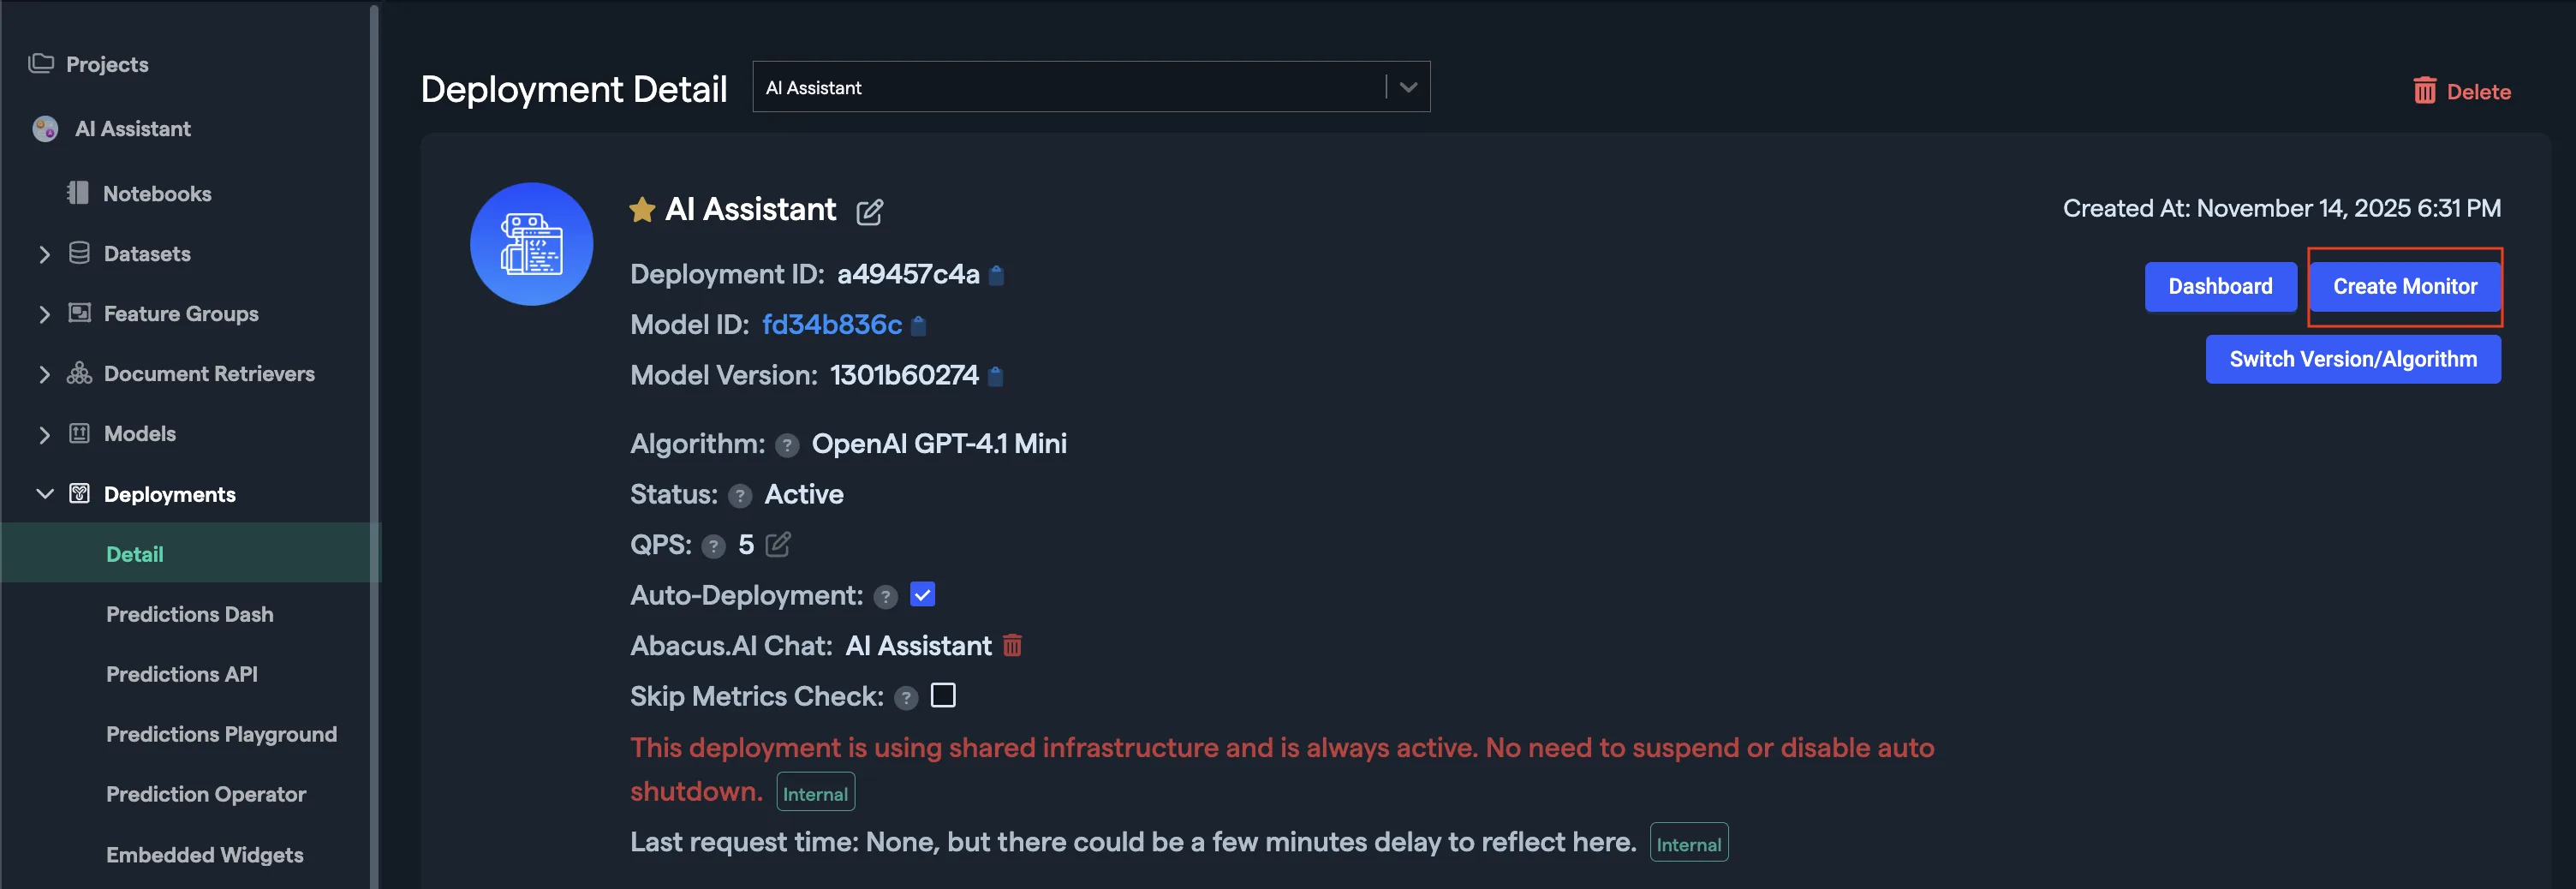
Once you have deployed your custom Chatbot, navigate to the deployment dashboard. From here, you are able to select to start monitoring your current chatbot.
Note: Monitoring uses a LLM to summarise user requests, and provide summaries. Activating this will consume tokens.
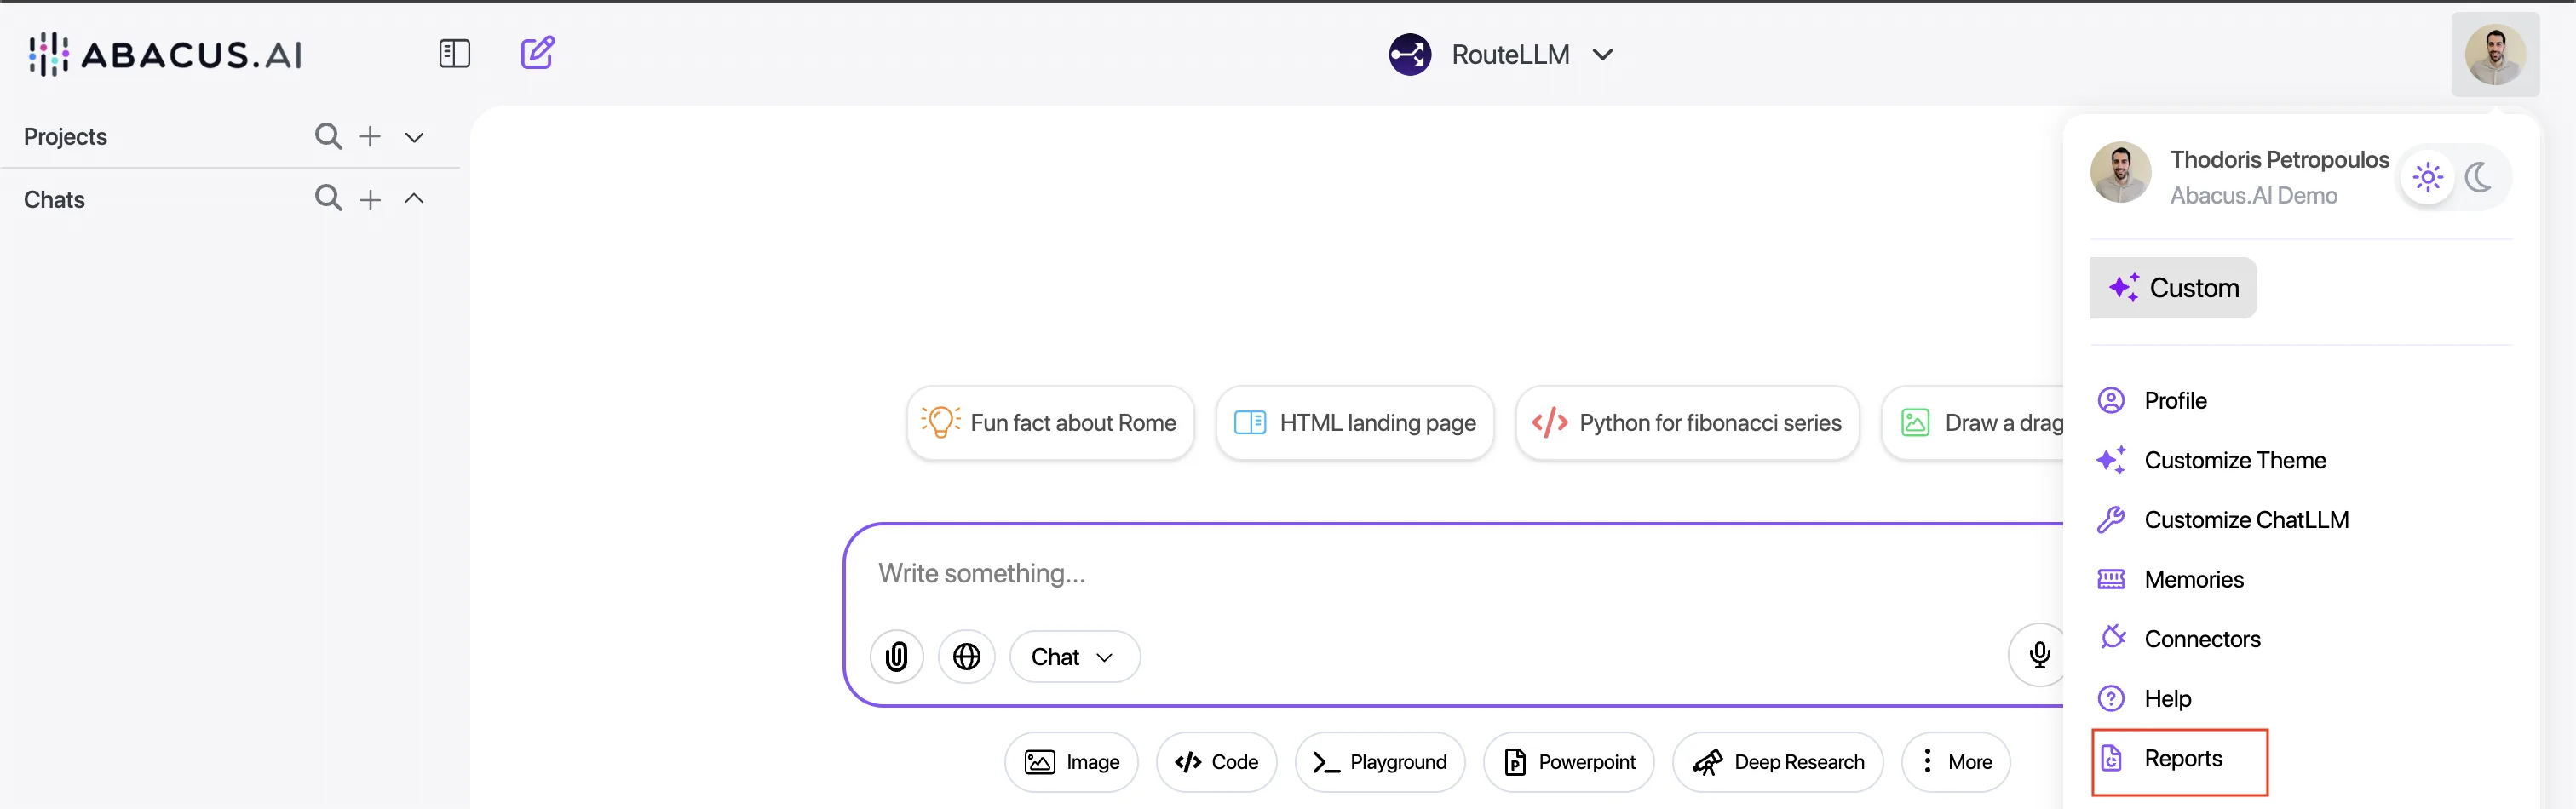
You can now monitor the usage, from within the deployments page (it will take a couple of minutes for monitoring to start) or you can use the Super Assistant UI to navigate to reports as below:
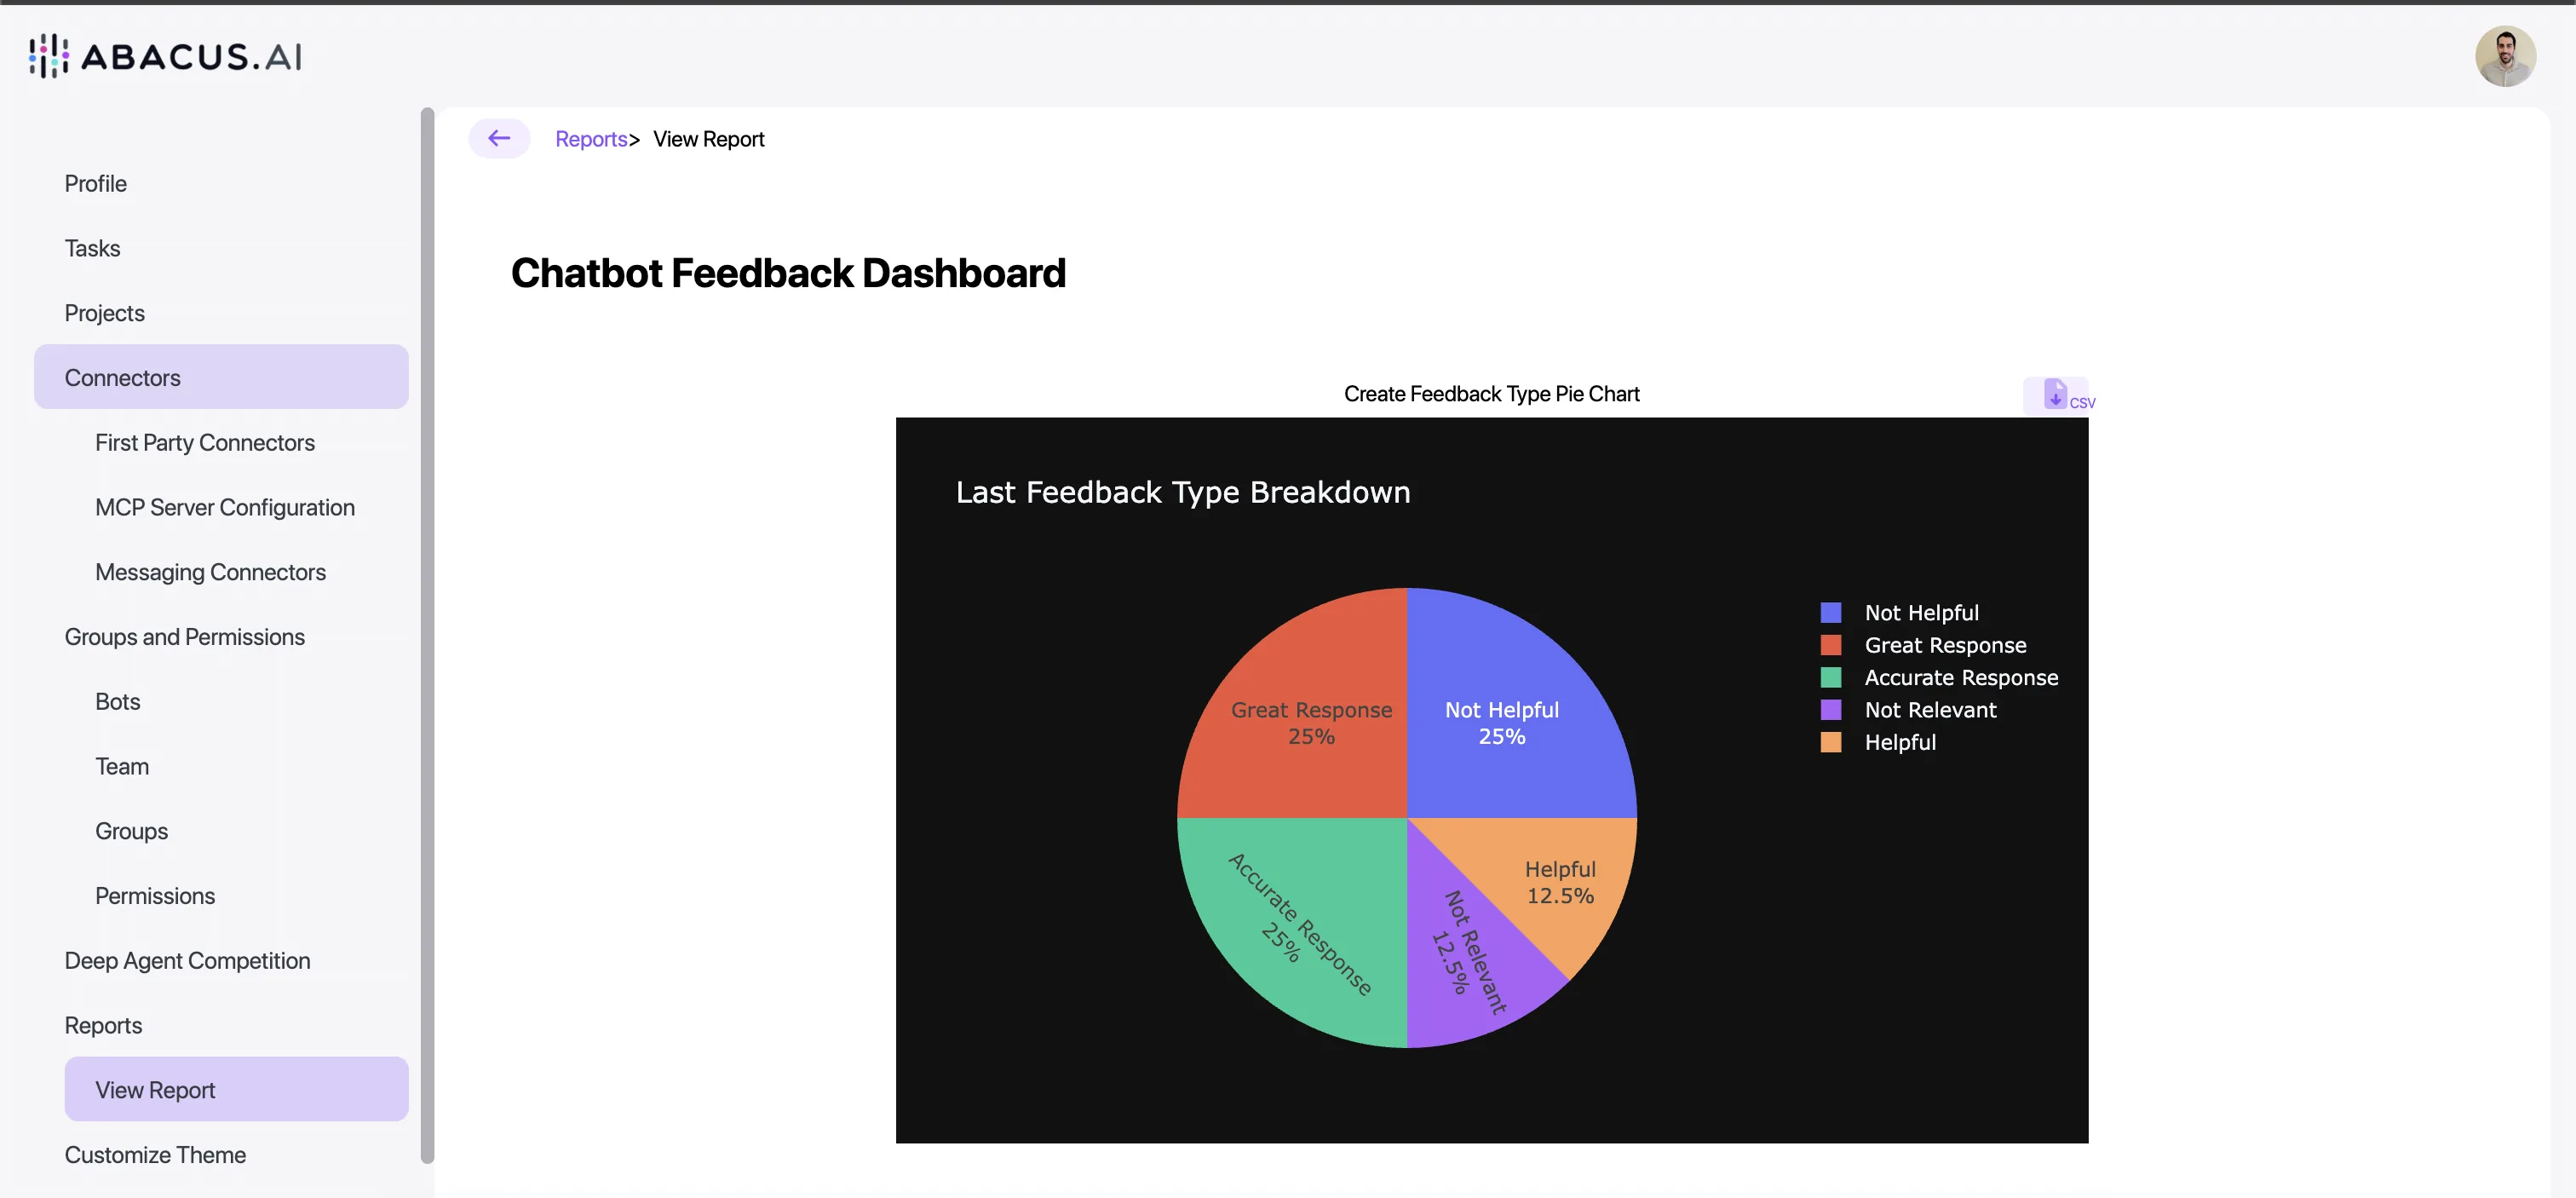
Since you clicked on "Create Monitor", Abacus will create a brand new Report page that you can use and also share with non-developers. The view will include statistics like:
- Top user
- Negative and Positive Feedback
- Top questions
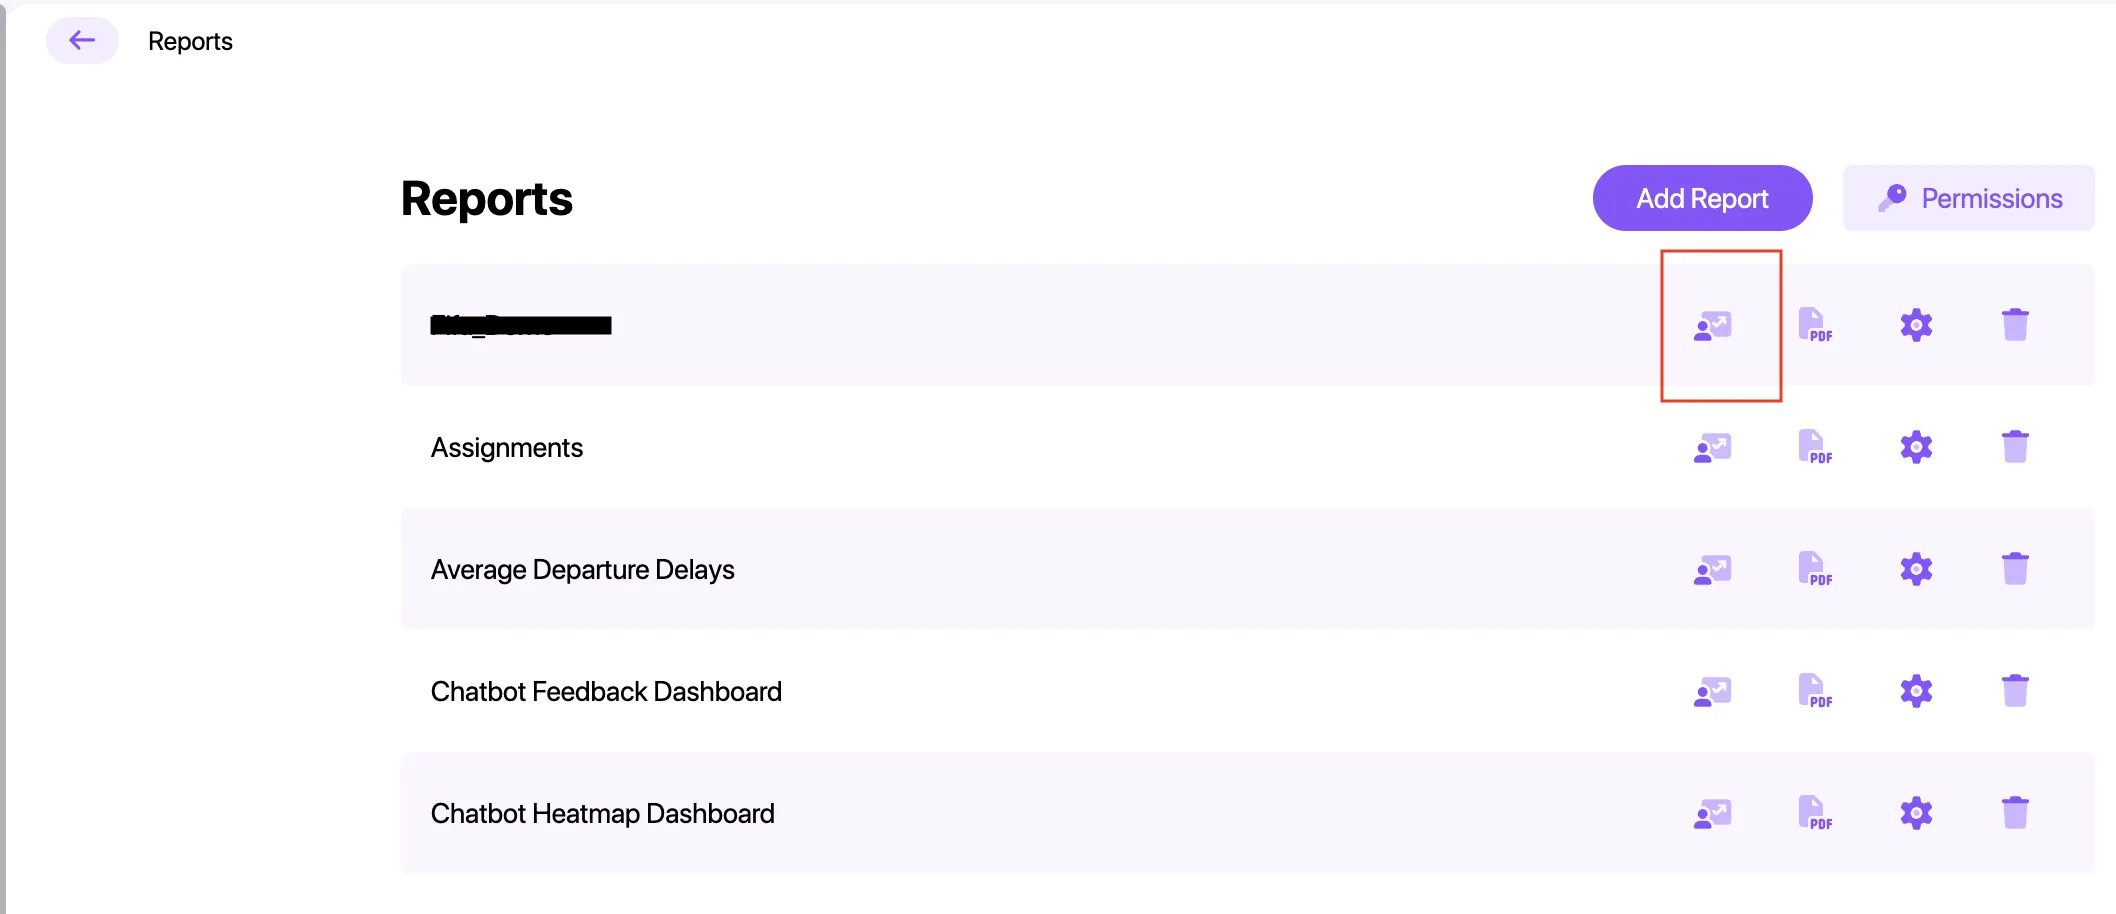
Another important consideration for this report page, is that by clicking on "Add Report" you can add any custom dashboard and serve it within this UI.
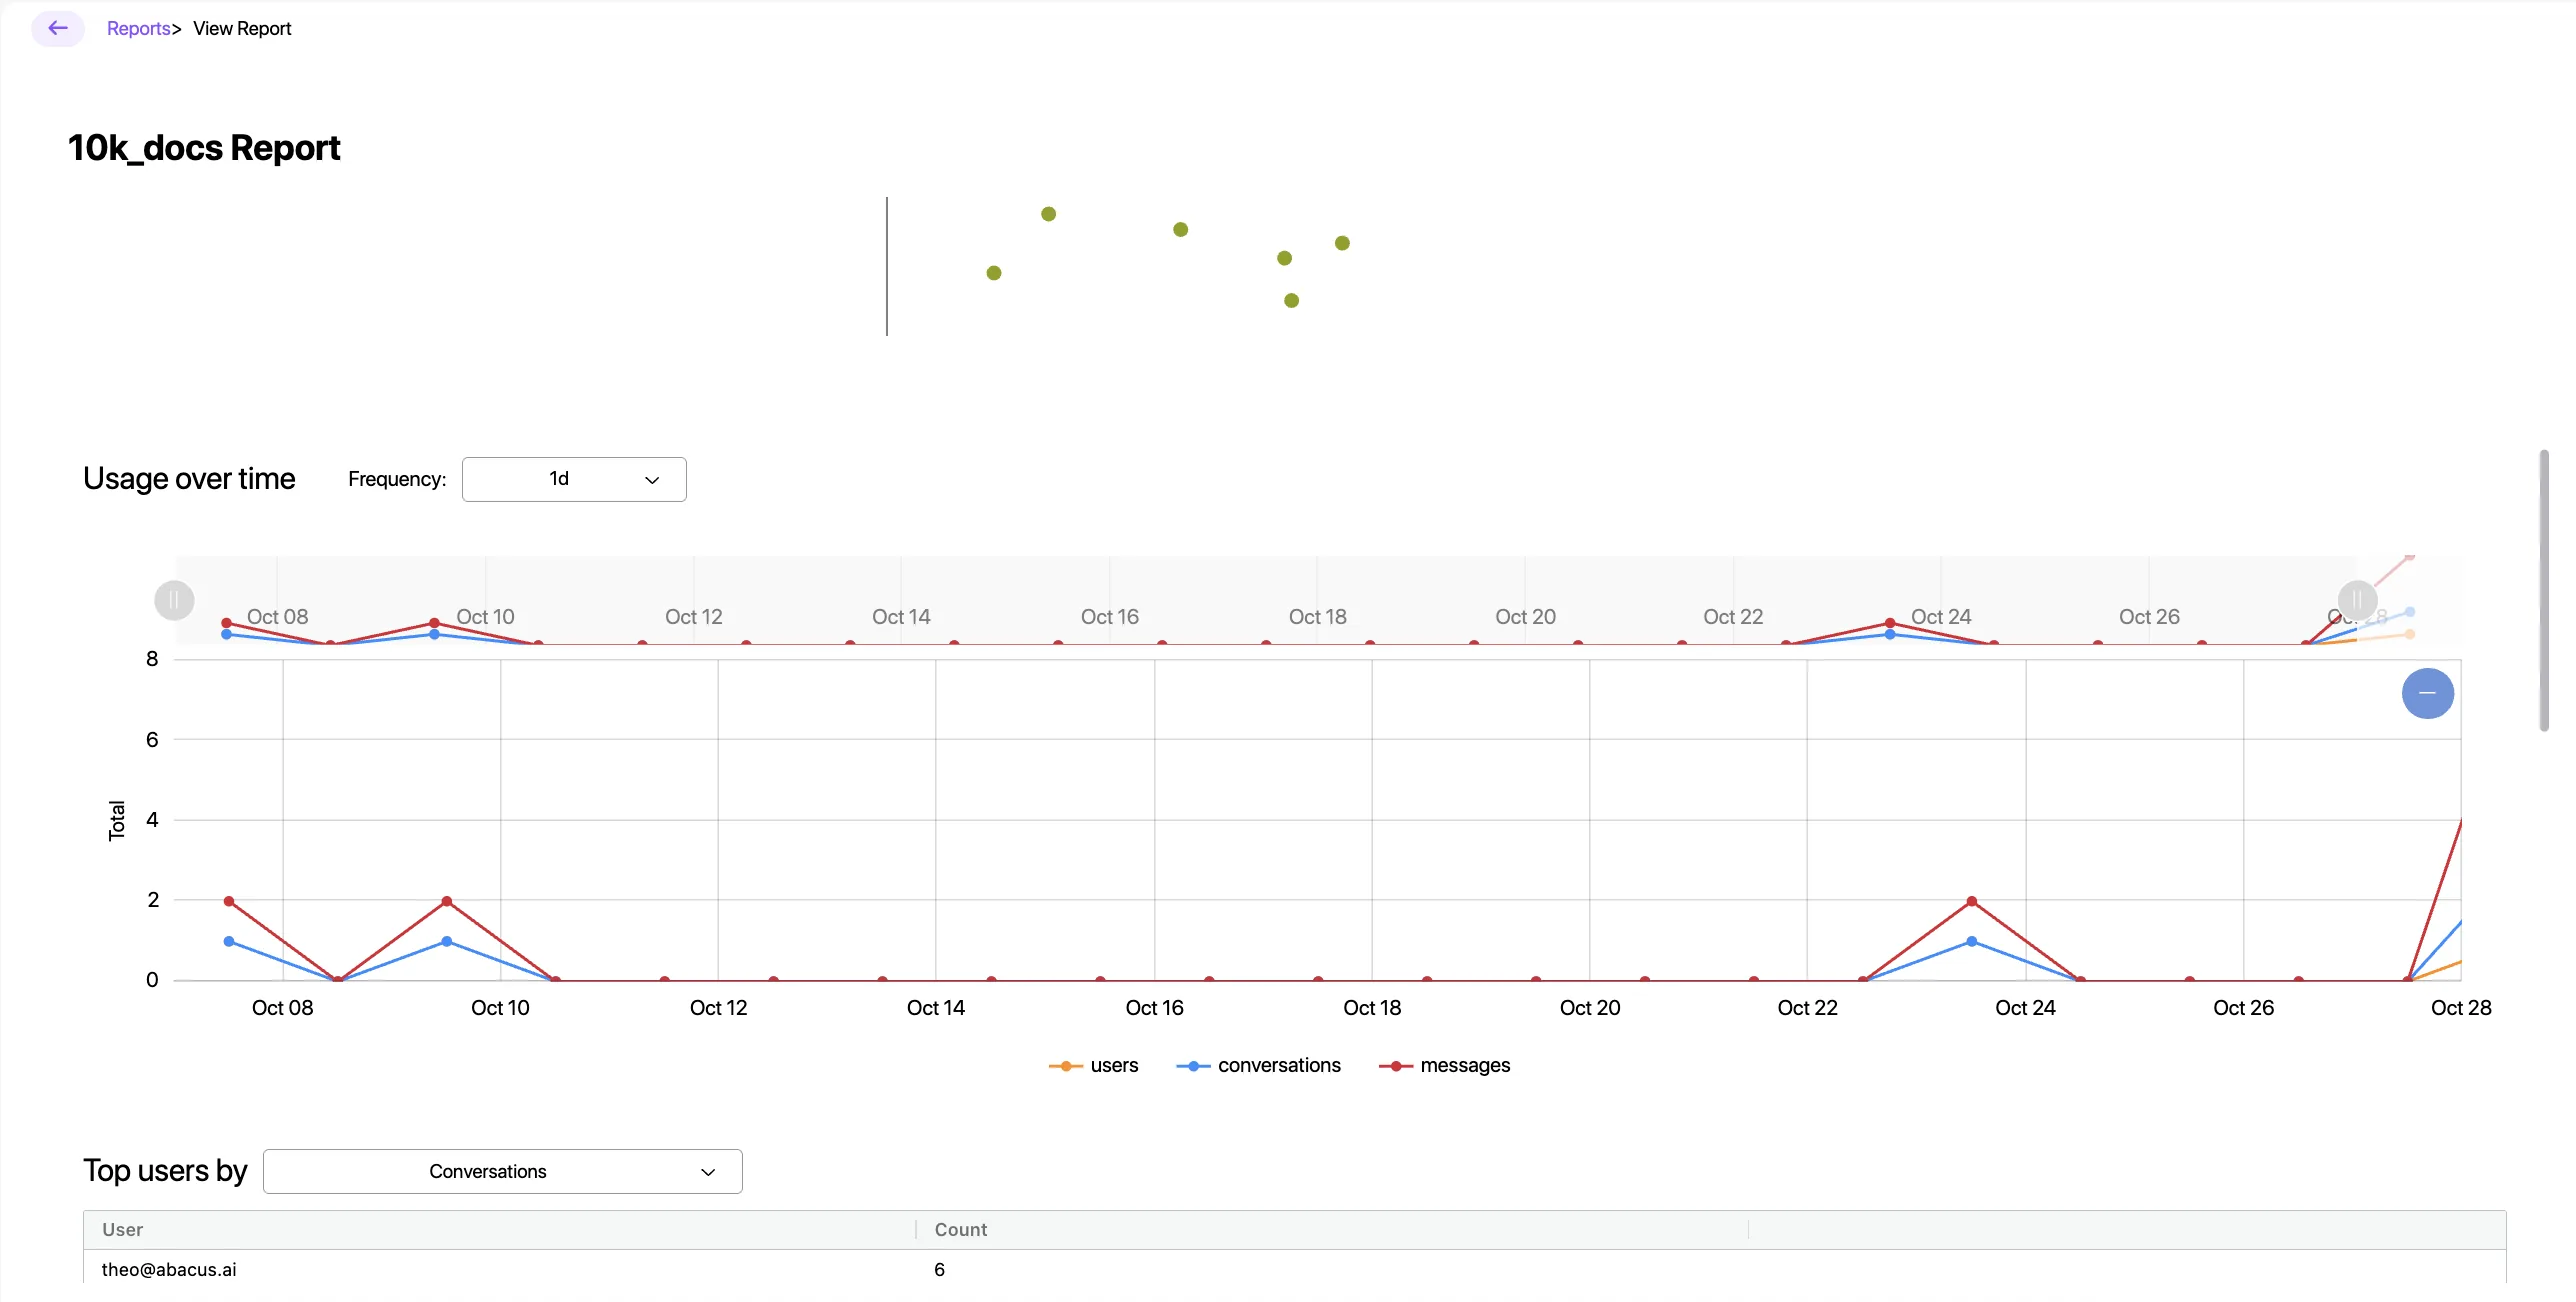
For example, the below report page was created using a combination of:
- Raw Abacus Usage Metrics
- And a custom Dashboard that was created for processing that data into a custom plot